Discover how students, researchers, and citizen scientists are using ColourWorker
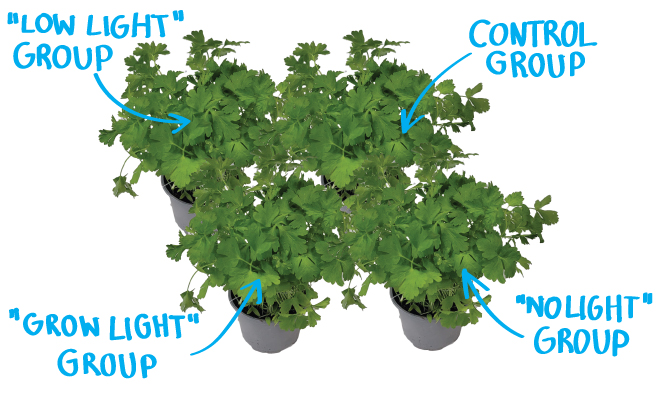
Education
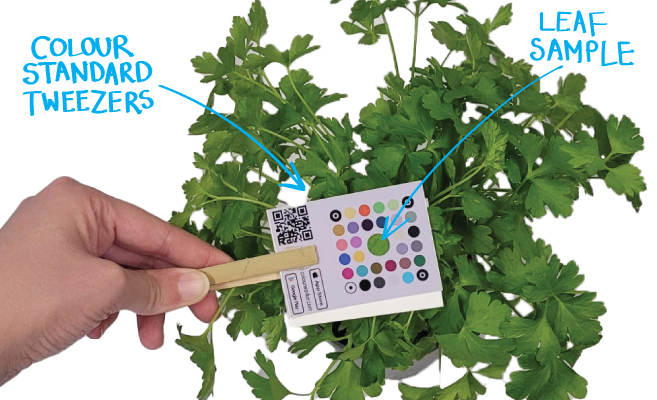
🌱 Student CREST Award
How does the light storage environment affect the appearence of Parsley plants?
Research
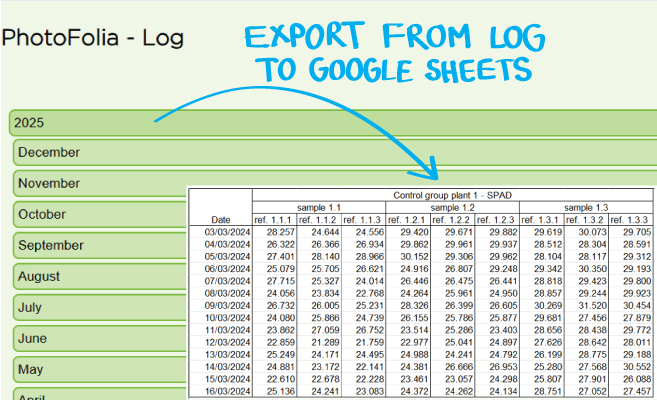
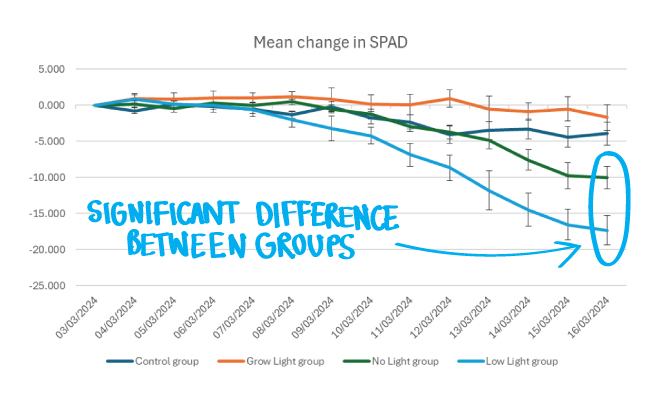
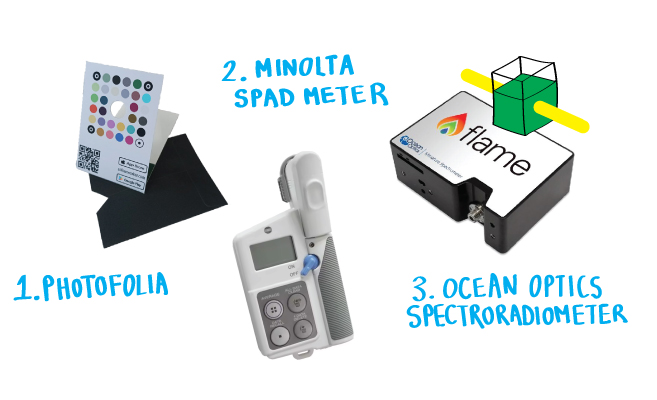
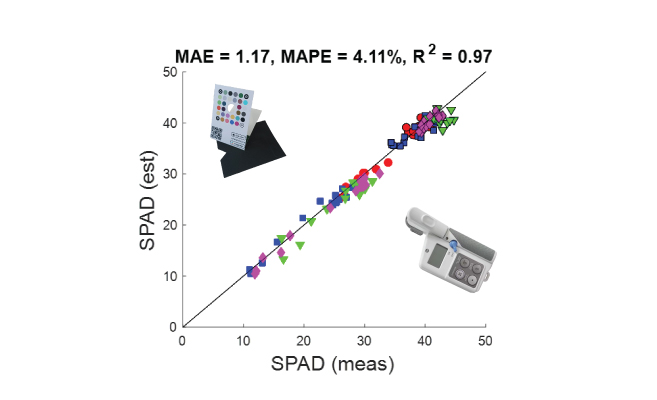
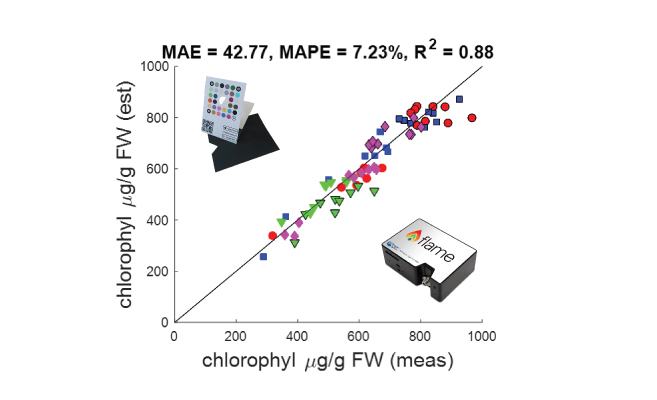
🌱 Performance Evaluation
Comparing image-based estimates of leaf SPAD-value and chlorophyll concentration made using PhotoFolia with Minolta 502 SPAD meter and laboratory assay.
Research
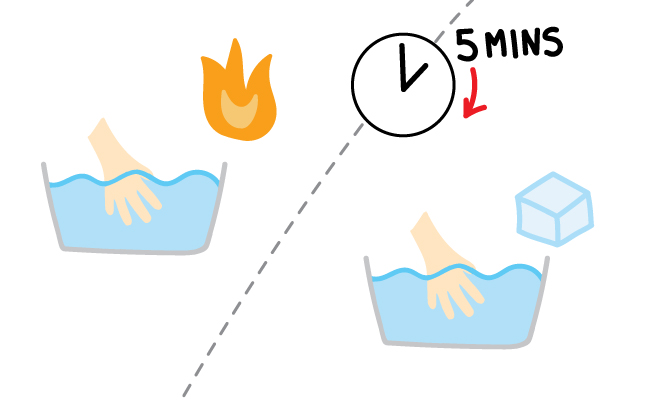
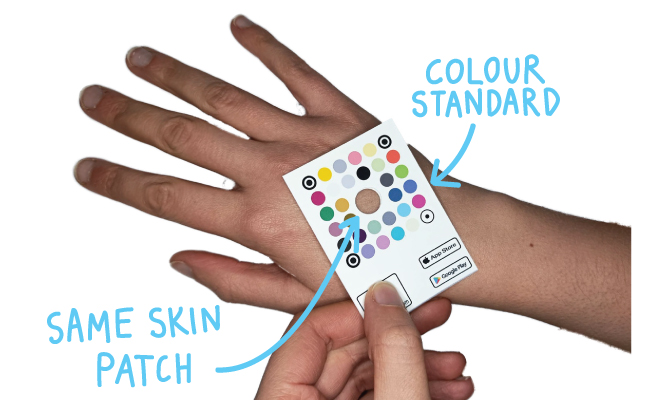
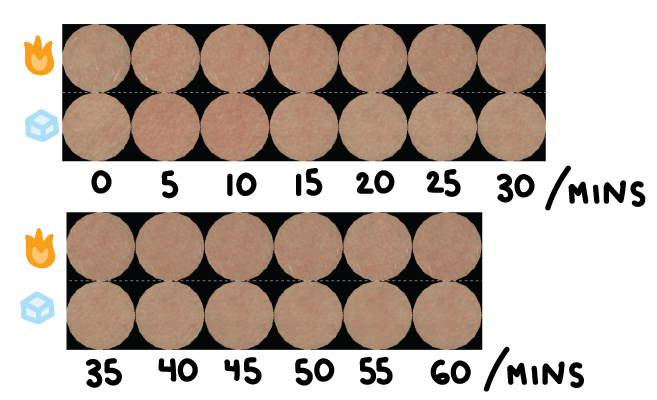
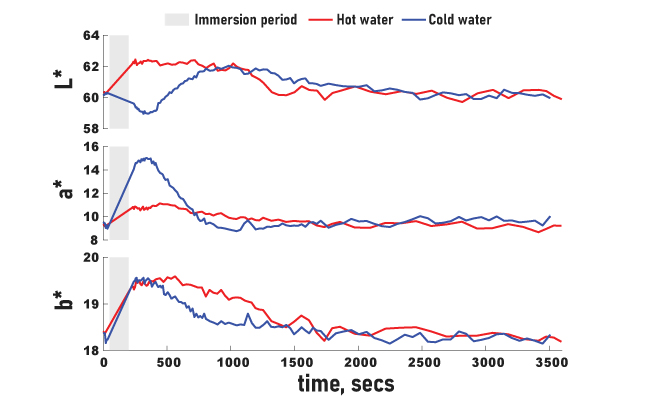
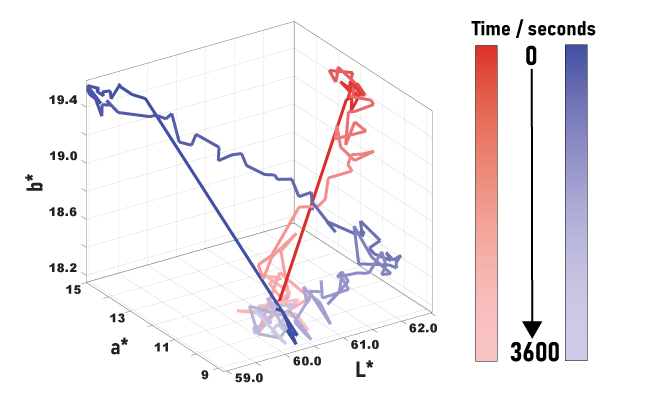
🌡️✋ Pilot Study
Tracking subtle skin colour dynamics in response to thermal stress.
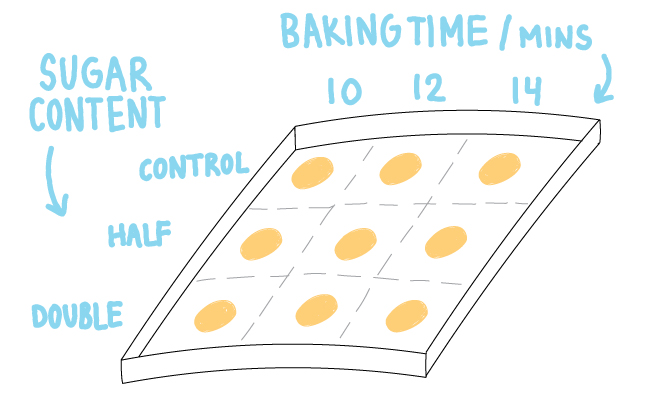
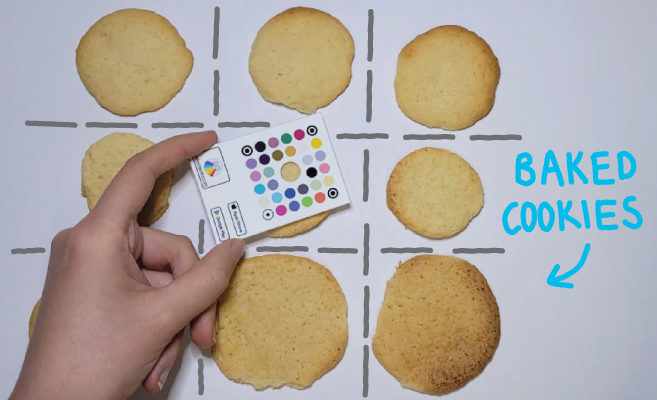
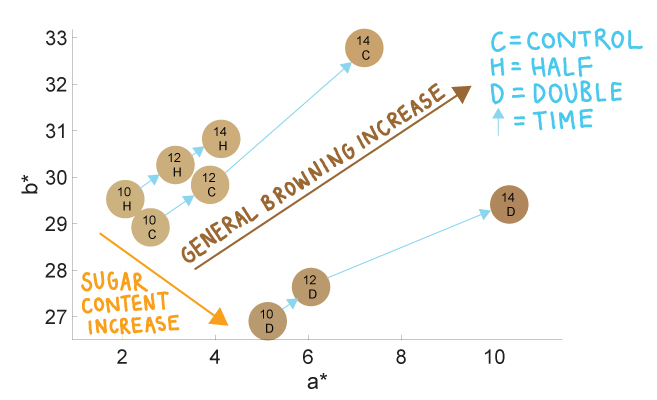
Education
👩🍳 Student Project
How does sugar content affect browning of cookies?